Merge overlapping striplogs#
Imagine we have a Striplog with overlapping Interval. We would like to be able to merge the Intervals in this Striplog, while following some rules about priority.
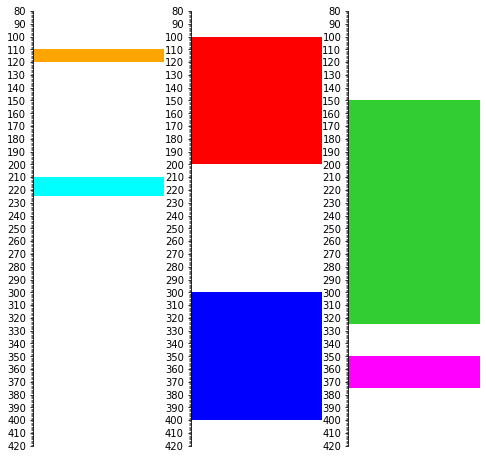
For example, imagine we have a striplog object, as shown below on the left. Note that the Intervals in the striplog have a time property, so I’ve ‘exploded’ that out along the horizontal axis so the Intervals don’t all overlap in this display. The point is that they overlap in depth.

NB This other property does not have to be time, it could be any property that we can use to make comparisons.
NB again The ‘mix’ (blended) merges indicated in the figure have not been implemented yet.
Make some data#
Let’s make some striplogs that look like these…
from striplog import Striplog

csv = """Top,Base,Comp Time,Comp Depth
100,200,2,a
110,120,1,b
150,325,3,c
210,225,1,d
300,400,2,e
350,375,3,f
"""

s = Striplog.from_csv(text=csv)
/opt/hostedtoolcache/Python/3.10.4/x64/lib/python3.10/site-packages/striplog/striplog.py:512: UserWarning: No lexicon provided, using the default.
  warnings.warn(w)
Here’s what the first Interval looks like:
s[0]
| top | 100.0 | ||||
| primary |
| ||||
| summary | 100.00 m of 2.0, a | ||||
| description | |||||
| data | |||||
| base | 200.0 |
We’ll need a Legend so we can make nice plots:
from striplog import Legend

# Data for legend (for display)...
leg_csv = """Colour,Comp Depth
red,a
orange,b
limegreen,c
cyan,d
blue,e
magenta,f
"""

legend = Legend.from_csv(text=leg_csv)
Now we can make a plot. I’ll make the Intervals semi-transparent so you can see how they overlap:
s.plot(legend=legend, lw=1, aspect=3, alpha=0.35)

It’s not all that pretty, but we can also plot each time separately as in the figure we started with:
import matplotlib.pyplot as plt

fig, (ax0, ax1, ax2) = plt.subplots(ncols=3, sharey=True, figsize=(8, 8))
s.find('1.0').plot(legend=legend, ax=ax0)
s.find('2.0').plot(legend=legend, ax=ax1)
s.find('3.0').plot(legend=legend, ax=ax2)
plt.ylim(420, 80)
(420.0, 80.0)

Merge#
We’d like to merge the Intervals so that everything retains depth order of course, but we want a few options about which Intervals should ‘win’ when there are several Intervals overlapping. For example, when looking at a particular depth, do we want to retain the Interval with the shallowest top? Or the deepest base? Or the greatest thickess? Or the one from the latest time?
s[0]
| top | 100.0 | ||||
| primary |
| ||||
| summary | 100.00 m of 2.0, a | ||||
| description | |||||
| data | |||||
| base | 200.0 |
So if we merge using top as a priority, we’ll get whichever Interval has the greatest (deepest) top at any given depth:
s.merge('top').plot(legend=legend, aspect=3)

If we use reverse=True then we get whichever has the shallowest top:
s.merge('top', reverse=True).plot(legend=legend, aspect=3)

Thickness priority#
What if we want to keep the thickest bed at any given depth?
s.merge('thickness').plot(legend=legend, aspect=3)

Or the thinnest bed?
s.merge('thickness', reverse=True).plot(legend=legend, aspect=3)

Using the other attribute#
Remember we also have the time attribute? We could use that… we’ll end up with which bed has the greatest (i.e. latest) top:
s.merge('time').plot(legend=legend, aspect=3)

…or earliest:
s.merge('time', reverse=True).plot(legend=legend, aspect=3)

Real data example#
Intervals are perforations. Many of them overlap. They all have datetimes. For a given depth, we want to keep the latest perforation.
from striplog import Striplog

remap = {'bottom':'base','type':'comp type'}
s = Striplog.from_csv("og815.csv", remap=remap)
/opt/hostedtoolcache/Python/3.10.4/x64/lib/python3.10/site-packages/striplog/striplog.py:512: UserWarning: No lexicon provided, using the default.
  warnings.warn(w)
from datetime import datetime

for iv in s:
    iv.primary.date = datetime.fromisoformat(iv.data['date'])
s[1]
| top | 1992.0 | ||||||
| primary |
| ||||||
| summary | 13.00 m of perforation, 2008-06-23 00:00:00 | ||||||
| description | |||||||
| data |
| ||||||
| base | 2005.0 |
s.plot(alpha=0.25)

Merge the perfs#
Now we can merge based on date:
sm = s.merge('date')
leg = """colour,comp type
limegreen,perforation
red,squeeze"""
from striplog import Legend

legend = Legend.from_csv(text=leg)

sm.plot(legend, lw=1, aspect=5)

sm.find_overlaps()
There are none, that’s good!
Export to Petrel#
print(sm.to_csv())
Top,Base,Component
1986.0,1992.0,"Perforation, 2008-06-24 00:00:00"
1992.0,1995.0,"Perforation, 2008-06-23 00:00:00"
1995.0,2000.0,"Perforation, 2015-11-14 00:00:00"
2000.0,2010.0,"Perforation, 2018-07-31 00:00:00"
2018.0,2023.0,"Perforation, 2009-10-23 00:00:00"
2037.0,2053.0,"Perforation, 2009-10-23 00:00:00"
2100.0,2105.0,"Perforation, 2018-07-31 00:00:00"
2112.0,2119.0,"Perforation, 2008-04-28 00:00:00"
2119.0,2127.0,"Perforation, 2008-04-28 00:00:00"
2132.0,2136.0,"Perforation, 2012-05-30 00:00:00"
2136.0,2141.0,"Perforation, 2002-06-05 00:00:00"
2180.0,2189.0,"Perforation, 2015-11-14 00:00:00"
2189.0,2195.0,"Perforation, 2015-11-13 00:00:00"
2243.0,2245.0,"Perforation, 2012-05-29 00:00:00"
2245.0,2246.0,"Squeeze, 2008-04-28 00:00:00"
2246.0,2250.0,"Squeeze, 2002-06-03 00:00:00"
2255.0,2266.0,"Squeeze, 2008-04-28 00:00:00"
2266.0,2270.0,"Squeeze, 2002-06-03 00:00:00"
2292.0,2298.0,"Squeeze, 2002-06-03 00:00:00"
2310.0,2320.0,"Squeeze, 2002-06-03 00:00:00"
2344.0,2348.0,"Squeeze, 1976-05-28 00:00:00"
2352.0,2362.0,"Squeeze, 1976-05-28 00:00:00"
2369.0,2374.0,"Squeeze, 1976-05-25 00:00:00"
2426.0,2431.0,"Perforation, 1972-10-21 00:00:00"
2431.0,2439.0,"Perforation, 1972-10-30 00:00:00"
This isn’t quite right for Petrel.
Let’s make another format.
def _to_petrel_csv(strip, attr, null):
    """
    Make Petrel-ready CSV text for a striplog
    """
    csv = ""
    gap_top = 0
    for iv in strip.merge_neighbours():
        if iv.top.middle != gap_top:
            csv += f"{gap_top},{null}\n"
        csv += f"{iv.top.middle},{getattr(iv.primary, attr)}\n"
        gap_top = iv.base.middle
    csv += f"{iv.base.middle},{null}\n"
    return csv

def to_petrel(fname, strip, attr, null=None):
    """
    Make a Petrel-ready CSV file.

    Args
        fname (str): the filename, including extension
        strip (Striplog): the striplog
        null (str): what to use for nulls

    Returns
        None (writes file as side effect)
    """
    if null is None:
        null = "-999.25"
    with open(fname, 'w') as f:
        f.write(_to_petrel_csv(strip, attr, null))
    return
print(_to_petrel_csv(sm, attr='type', null=-999.25))
0,-999.25
1986.0,perforation
2010.0,-999.25
2018.0,perforation
2023.0,-999.25
2037.0,perforation
2053.0,-999.25
2100.0,perforation
2105.0,-999.25
2112.0,perforation
2127.0,-999.25
2132.0,perforation
2141.0,-999.25
2180.0,perforation
2195.0,-999.25
2243.0,perforation
2245.0,squeeze
2250.0,-999.25
2255.0,squeeze
2270.0,-999.25
2292.0,squeeze
2298.0,-999.25
2310.0,squeeze
2320.0,-999.25
2344.0,squeeze
2348.0,-999.25
2352.0,squeeze
2362.0,-999.25
2369.0,squeeze
2374.0,-999.25
2426.0,perforation
2439.0,-999.25
to_petrel("well_for_petrel.csv", sm, attr='type')
© 2020 Agile Scientific, licenced CC-BY